Trucking42 School
How can a dispatcher use the best tool from DAT?
One of the main tools in the work of the truck dispatcher, without which he cannot do, is the load board.

If you started your journey in dispatching and want to book the best cargo, this information is for you.
The article was written at the time of the market situation January-February 2021
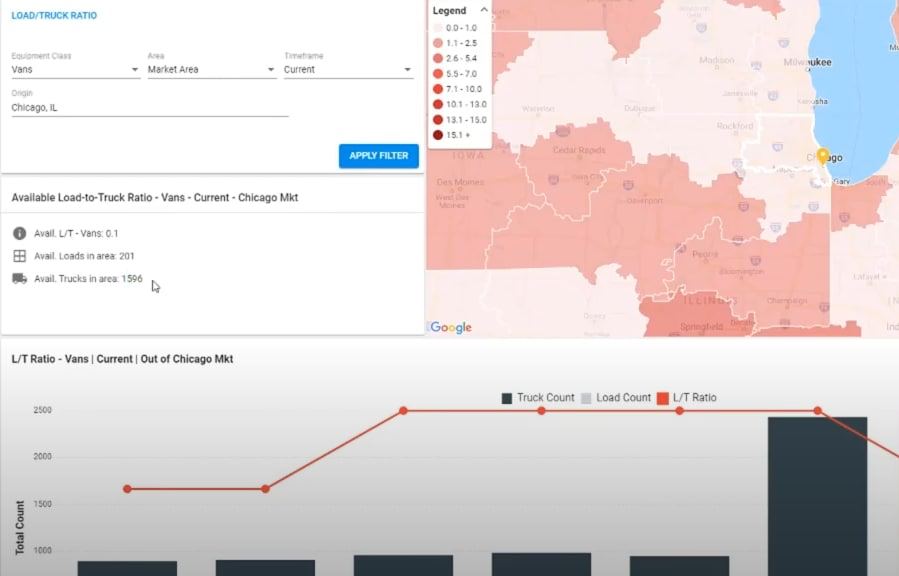
This is the Hot Market Map interface - statistics from DAT , which shows how many tracks have accumulated in a particular area depending on the indicated time.
The article was written at the time of the market situation January-February 2021
This is the Hot Market Map interface - statistics from DAT , which shows how many tracks have accumulated in a particular area depending on the indicated time.
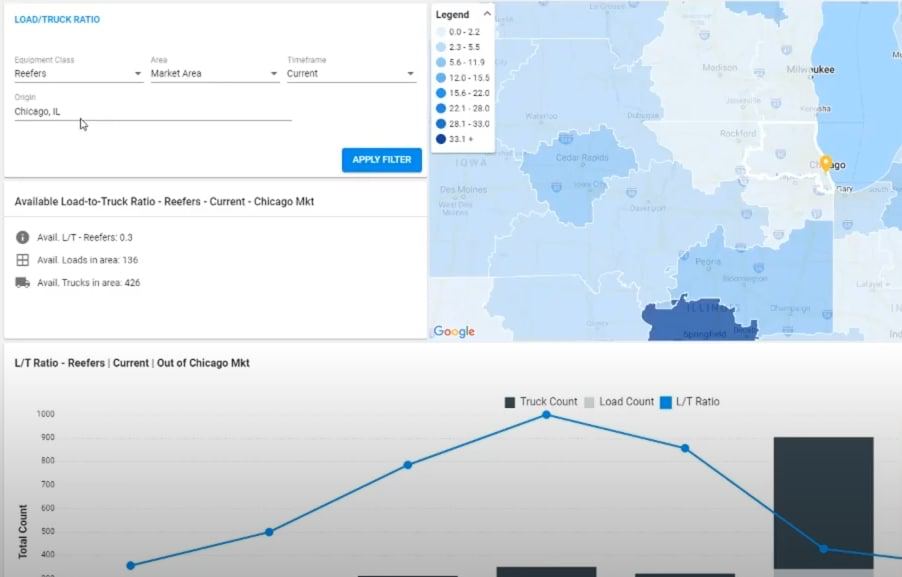
We must login to DAT , go to the HOT Market Map tool and set the necessary filters:
And now we can see the number of cargoes, the number of trucks in the specified area for a particular date and time.
- Select the type of track, for example, Reefers.
- Select area
- Select the period for which we want to view statistics
- Select a region, for example, Chicago
And now we can see the number of cargoes, the number of trucks in the specified area for a particular date and time.
A very bad ratio if the number of trucks exceeds the number of published loads for those who are now in Chicago. This is because if you want to leave this area now, the cargoes that appear on the LoudBoard will quickly fly away. Rates will shift down, as brokers know that there are a lot of trucks and few cargoes. As a result, the broker will be sold at cheap prices, which is not beneficial either for the company, or for the driver, or for the dispatcher.
The normal ratio for Chicago is, for example, 1000 loads and 600-700 trucks.
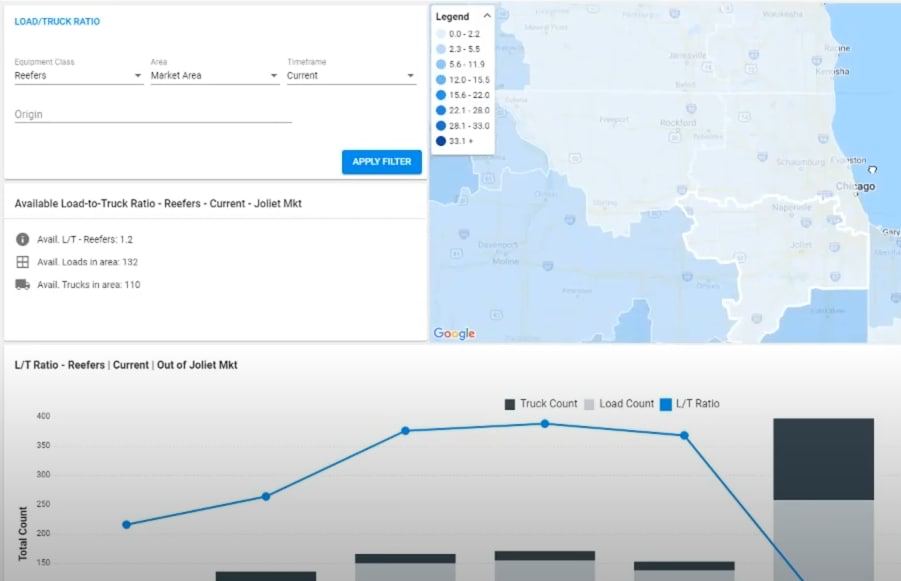
Observing such a low coefficient, we conclude that the zone is inconvenient for us in terms of indicators. We can go to another area, a little lower and find the area where the number of cargo will exceed or at least equal the number of trucks.
If we scroll down, we can see what the DAT Los Angeles board was like for a certain amount of time. For example, at 5 am there were only 45 cargoes, 40 trucks were launched. By 10:00 people began to pull up and we see -203 loads and 247 trucks. Below we see that the trend is on a decline - there are few cargoes, everyone is leaving. As a result, the rates are bad.
The normal ratio for Chicago is, for example, 1000 loads and 600-700 trucks.
Observing such a low coefficient, we conclude that the zone is inconvenient for us in terms of indicators. We can go to another area, a little lower and find the area where the number of cargo will exceed or at least equal the number of trucks.
If we scroll down, we can see what the DAT Los Angeles board was like for a certain amount of time. For example, at 5 am there were only 45 cargoes, 40 trucks were launched. By 10:00 people began to pull up and we see -203 loads and 247 trucks. Below we see that the trend is on a decline - there are few cargoes, everyone is leaving. As a result, the rates are bad.
What is a board?
Let's go back to Chicago and try to choose another period - the last 7 days. And we will see by the day what the market was like.
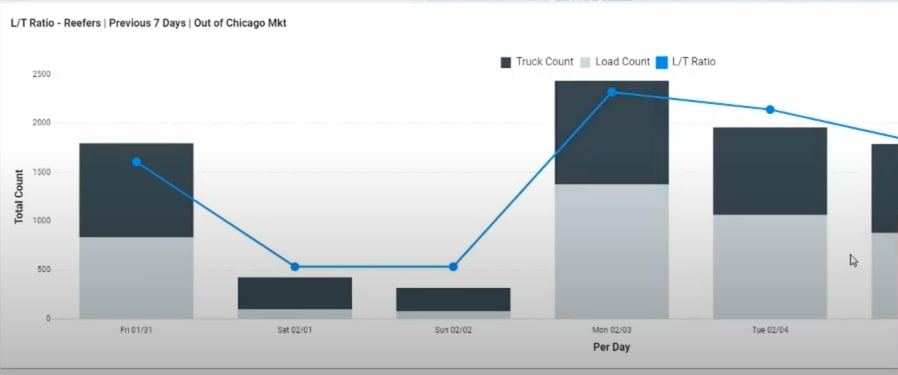
From Monday to Friday, a trend is visible - there is still an update. But we see that the picture is always slightly better on Monday than on Tuesday, and on Friday it is slightly better than on Thursday. For example, last Friday there were 836 cargoes, and on Thursday there were 793 cargoes.
article was written at the time of the market situation in January-February 2022
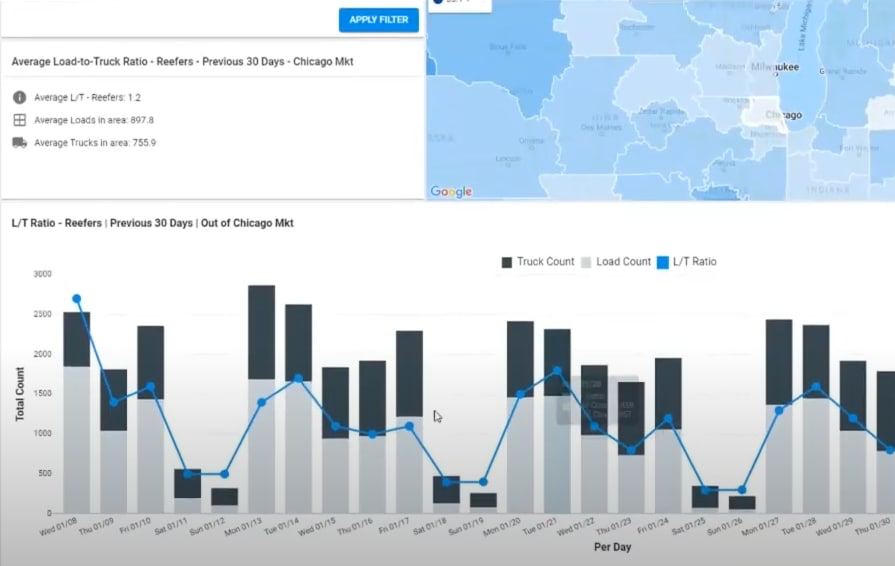
We can make a little forecast. Let's choose the period - the last 30 days, the region - Chicago, the date - January 13 / Monday - we see tense moments for Chicago.
On this day, 1700 loads and 1200 trucks were published - this is a more or less good situation. Further, we observe a picture that is declining - the number of trucks is unchanged, and the number of cargoes has fallen, respectively, the rates (rates) have fallen.
We see that it was in January - judging by the diagram, the extreme points went down, respectively, the trend went down.
Each subsequent Monday was slightly worse than the previous one, from which we can assume that the next Monday will also decline.
If you know the logistics market well, you should definitely understand where is the “Monday” that will turn the course of events.
For example, if it is now January 5th and in three days the 8th day, you make a forecast that the statistics will be positive. But in fact, January 8 is the date when everything stops, shippers stop sending goods, and the number of trucks is unchanged. And on the 8th, when you come to work and look for loads, there will be many like you, but few loads.
Accordingly, your truck can stand all day, or you will take a bad load at an unfortunate rate.
In order for the truck not to be idle and for you to book cargo at a normal price for a specific period, you must understand what is happening in the market.
That's what the Hot Market Map tool is for .
article was written at the time of the market situation in January-February 2022
We can make a little forecast. Let's choose the period - the last 30 days, the region - Chicago, the date - January 13 / Monday - we see tense moments for Chicago.
On this day, 1700 loads and 1200 trucks were published - this is a more or less good situation. Further, we observe a picture that is declining - the number of trucks is unchanged, and the number of cargoes has fallen, respectively, the rates (rates) have fallen.
We see that it was in January - judging by the diagram, the extreme points went down, respectively, the trend went down.
Each subsequent Monday was slightly worse than the previous one, from which we can assume that the next Monday will also decline.
If you know the logistics market well, you should definitely understand where is the “Monday” that will turn the course of events.
For example, if it is now January 5th and in three days the 8th day, you make a forecast that the statistics will be positive. But in fact, January 8 is the date when everything stops, shippers stop sending goods, and the number of trucks is unchanged. And on the 8th, when you come to work and look for loads, there will be many like you, but few loads.
Accordingly, your truck can stand all day, or you will take a bad load at an unfortunate rate.
In order for the truck not to be idle and for you to book cargo at a normal price for a specific period, you must understand what is happening in the market.
That's what the Hot Market Map tool is for .
The Forecasting
First, from the statistics above, you can see what happens next in the market. Secondly, you need to book cargo in advance - this is one of the keys to success.
Let's see what happens on Thursday, if you sent a driver from Pennsylvania to Illinois and plan to arrive on Friday / Saturday, look at the loads at the moment, that is, in place.
On Saturday there were 327 trucks and only 99 loads, so if you come to work on Saturday and try to find a load, then most likely you will get a bad result, because there will be many like you.
If you had looked ahead to the trend for Saturday in Chicago, you would likely have booked a shipment on Thursday and thus ensured a good result.
Even if you see on Thursday that the price for loads on Saturday is not very good, but according to statistics you understand how much the results can fall, then you will book a load 20 cents cheaper, but you will be insured in advance.
What's going on in the market?
In general, this tool will help you if you approach cargo search from a logical point of view.
If you adequately understand the scheme of work and operate with numbers, you will find much more tools for yourself that will help increase your income.
This video tutorial is aimed at the initial level of dispatching or for those who do not yet know how to use this tool.
Also for those who have their own strategy and tactics, but are distrustful of numbers. Truck Dispatcher Course MentorNick Pleshuv uses this tool almost every day. The figures that are displayed here are as close to reality as possible.
For fun, let's see what's going on in the same Chicago with Dry Vans.
The picture is deplorable: 1600 trucks and 200 cargo, which indicates a lot of competition among carriers. This means that the broker understands this and the rates from Chicago are falling. therefore, if you will be in Chicago or plan to be there later, then book cargo in advance. This will give you a certain temporary “cushion”, you will be able to negotiate a higher rate from the broker.
In which case will this tool help you?
There is a catch: a lot of brokers leave their cargoes for the future and post them at the very last moment specifically so that the carriers “fight” for this cargo. Because of this, you will be ready to take a smaller rate, just to leave the area. Brokers know this well and calculate the markets.
In general, they have a large coalition, they hold symposiums / meetings, help each other with information - all this gives them a great advantage, unlike us, cargo carriers.
We have a great wish that cargo carriers also communicate well, act in concert, share all possible tools.
We hope this information was useful to you. you will use this market and find application in your business.
Thank you for your attention!
Don't forget to share this article with those who might find it useful.
Don't forget to share this article with those who might find it useful.
